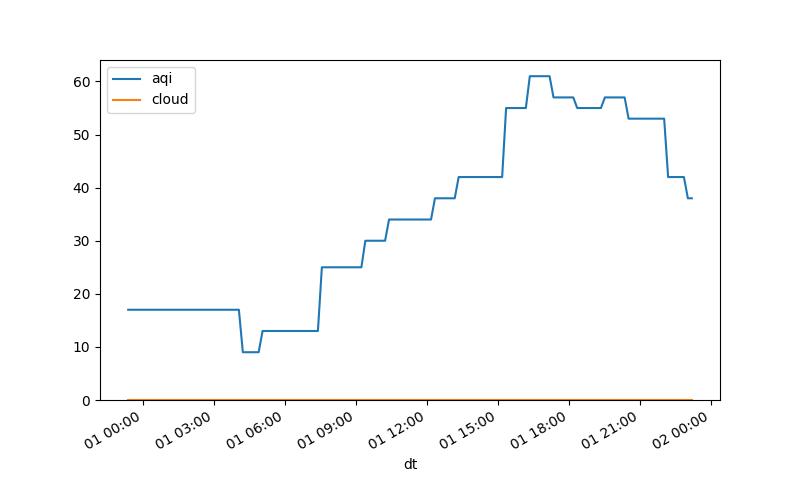
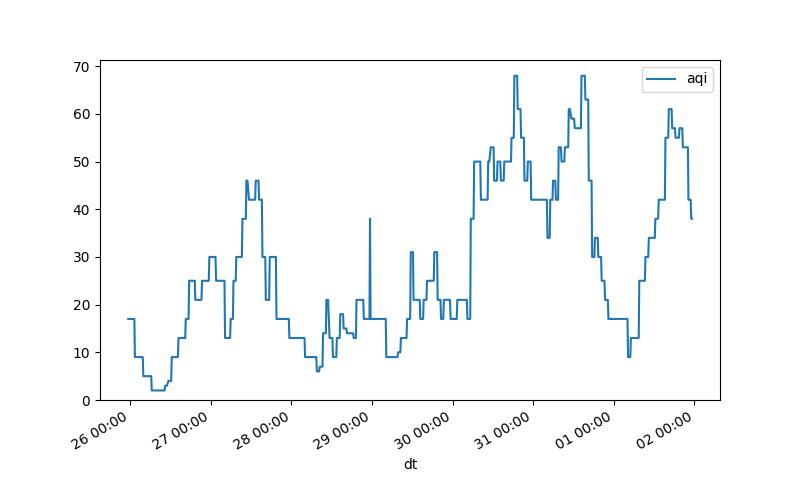
This is a crude page that shows a few graphs of the air quality on my porch. The first graph is just the last 24 hours, and the other one is for the last 7 days.
Both graphs include the AQI, not calculated by me. The AQI includes ozone and other things that are not included in the particulate counts, so it is possible to
have peaks in AQI that are not supported by any increase in particulates. This is just for interest, not to be used as a substitute for actual scientific and health
related advice.
Daily
Weekly
Earth Kaleidoscope

check
BS